.
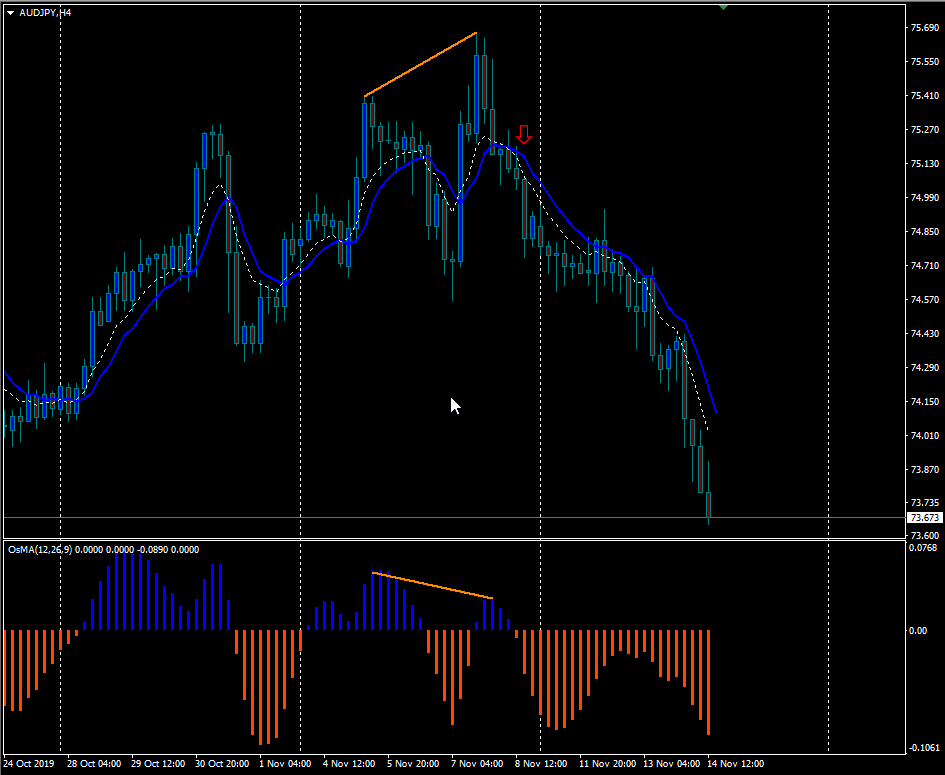
The Aud/Jpy sellers sold hard after ‘Tripple Highs Formed’ between late October and early November. Creating ‘Regular Bearish Divergence’ causing a huge selloff of 150 pips. So it was looking to be a bit ‘over – bought’ at the end of last week, and sure enough those traders do what they like to do best: “Buy Low And Sell High!”
.

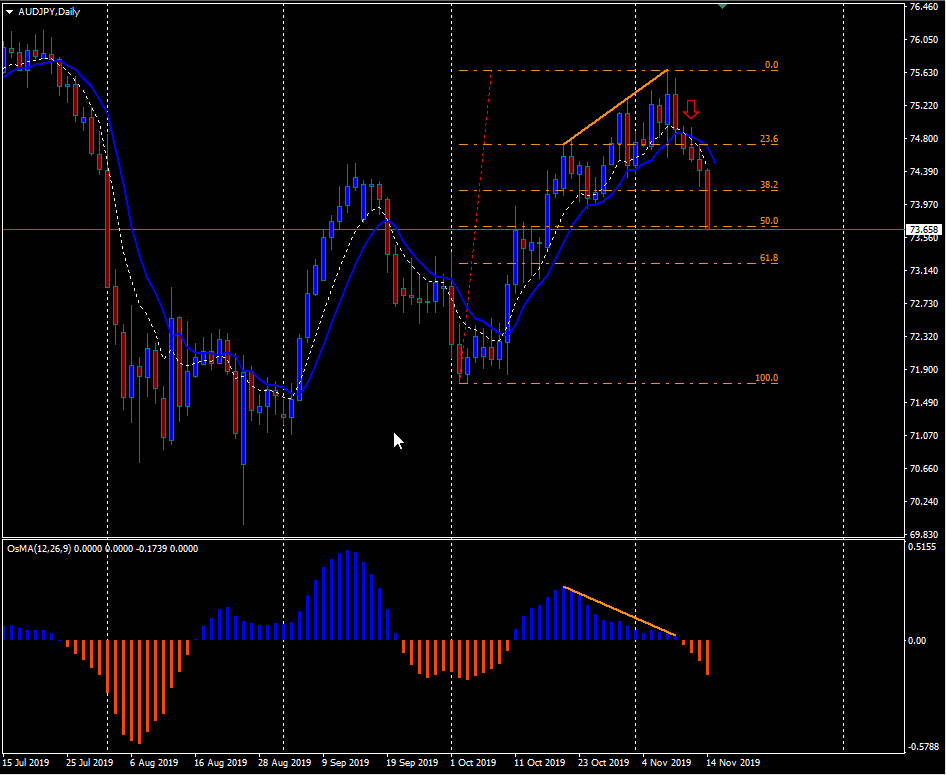
And looking at the AUD/JPY from another technical aspect using the Fibonacci measuring tool. The AUD/JPY just broke thru the 50% Retracement level from the October lows to the November highs with no end in sight. We have major support at 71.80, and resistance at 73.35.
.

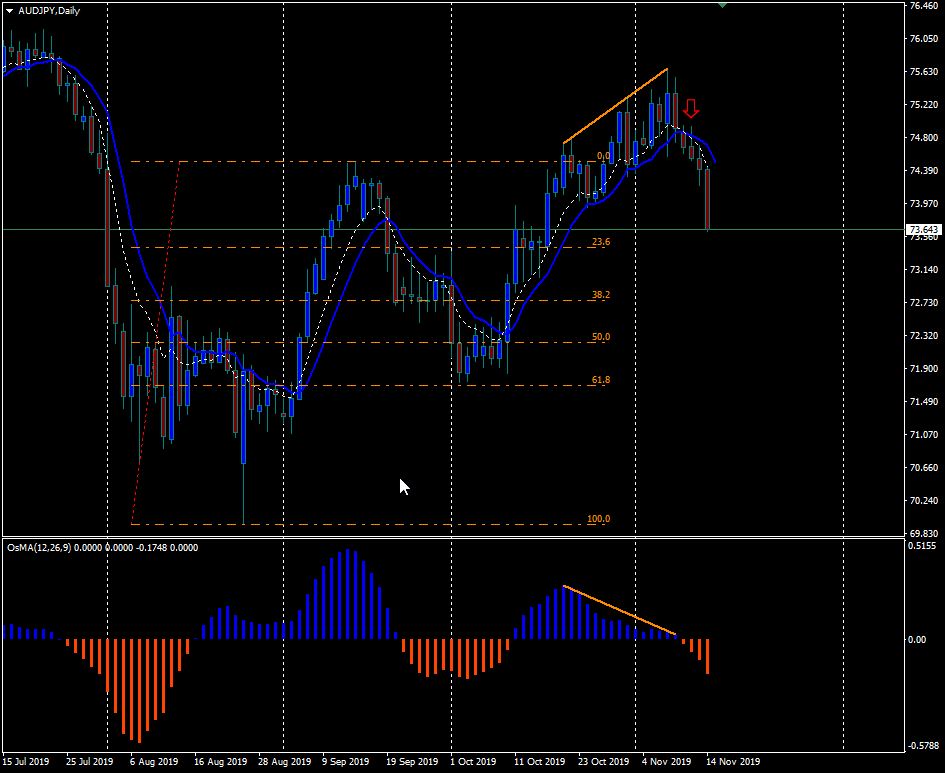
Now looking at the AUD/JPY from the August Low to the September High. So you can see just how powerful the Fibonacci Trading Tool really is. Not only did it bounce off the 61.8 Fibonacci level, but, it also hesitated at the 38.2 Fibonacci price level. However, don’t just take my word for it, look at the proof below fellow trader:
.

Check out the video traders…


